Performance and Statistics
When your campaign is live, your ad is shown to your targeted audience. Statistics like how many times your ads are shown (impressions) and clicks are collected daily.
On your Campaigns Dashboard, you can see all your campaigns' statistics - your original Budget, Amount Delivered, Impressions Booked, Impressions Delivered, Clicks, and CTR (click-through-rate).

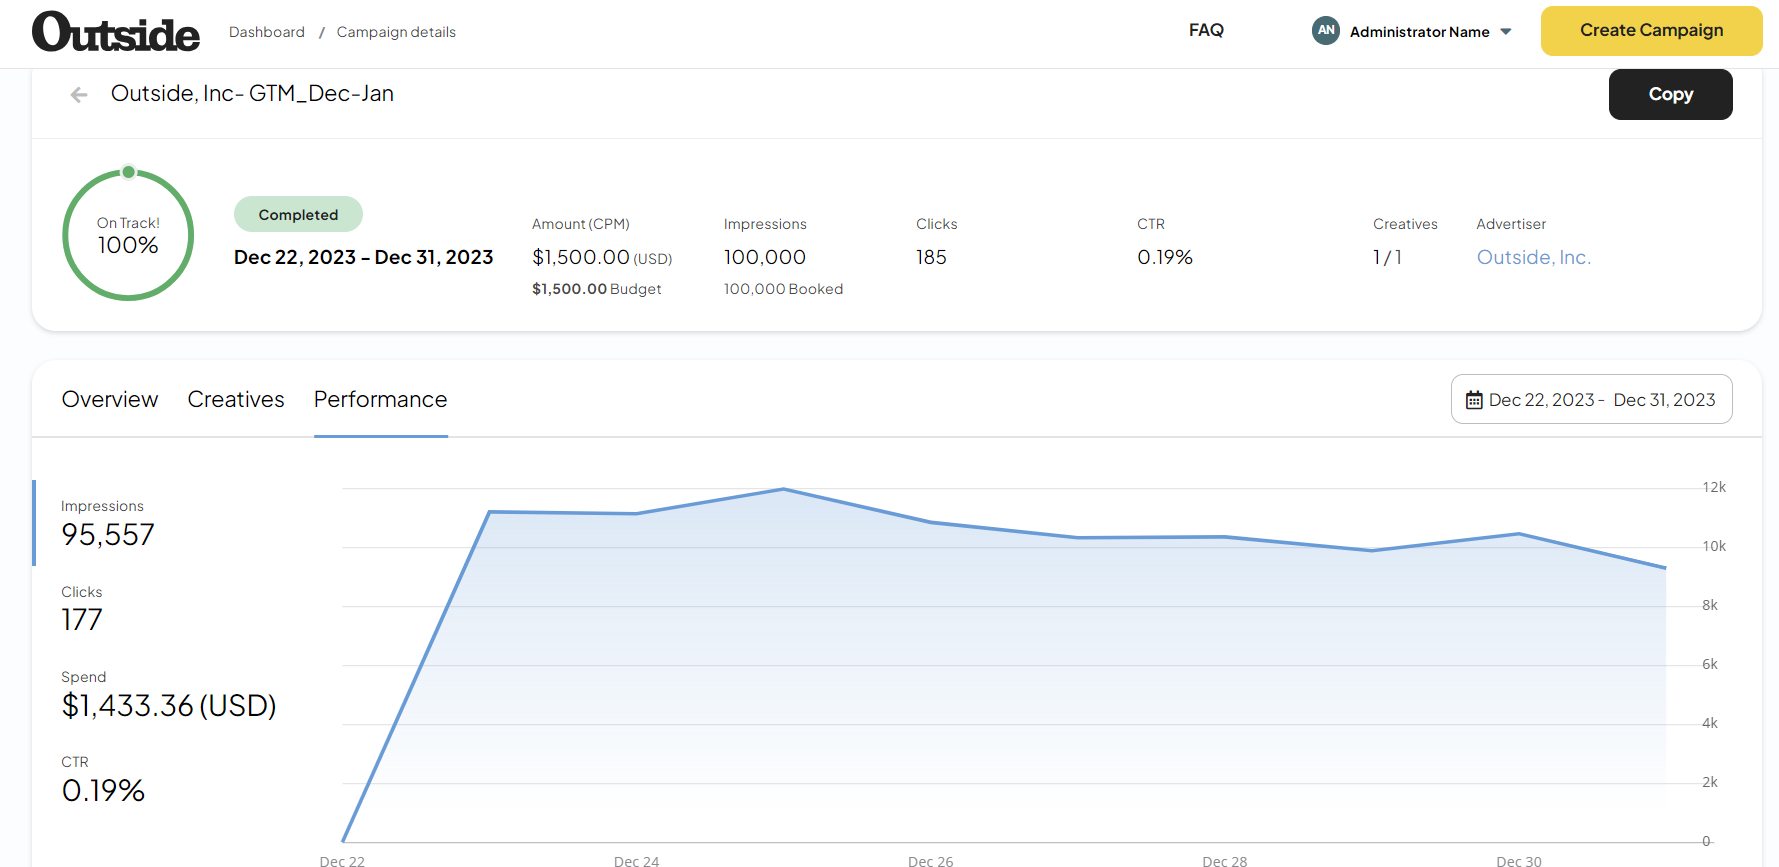
When you click into a campaign, you can view a daily Performance Chart, which is updated continuously.
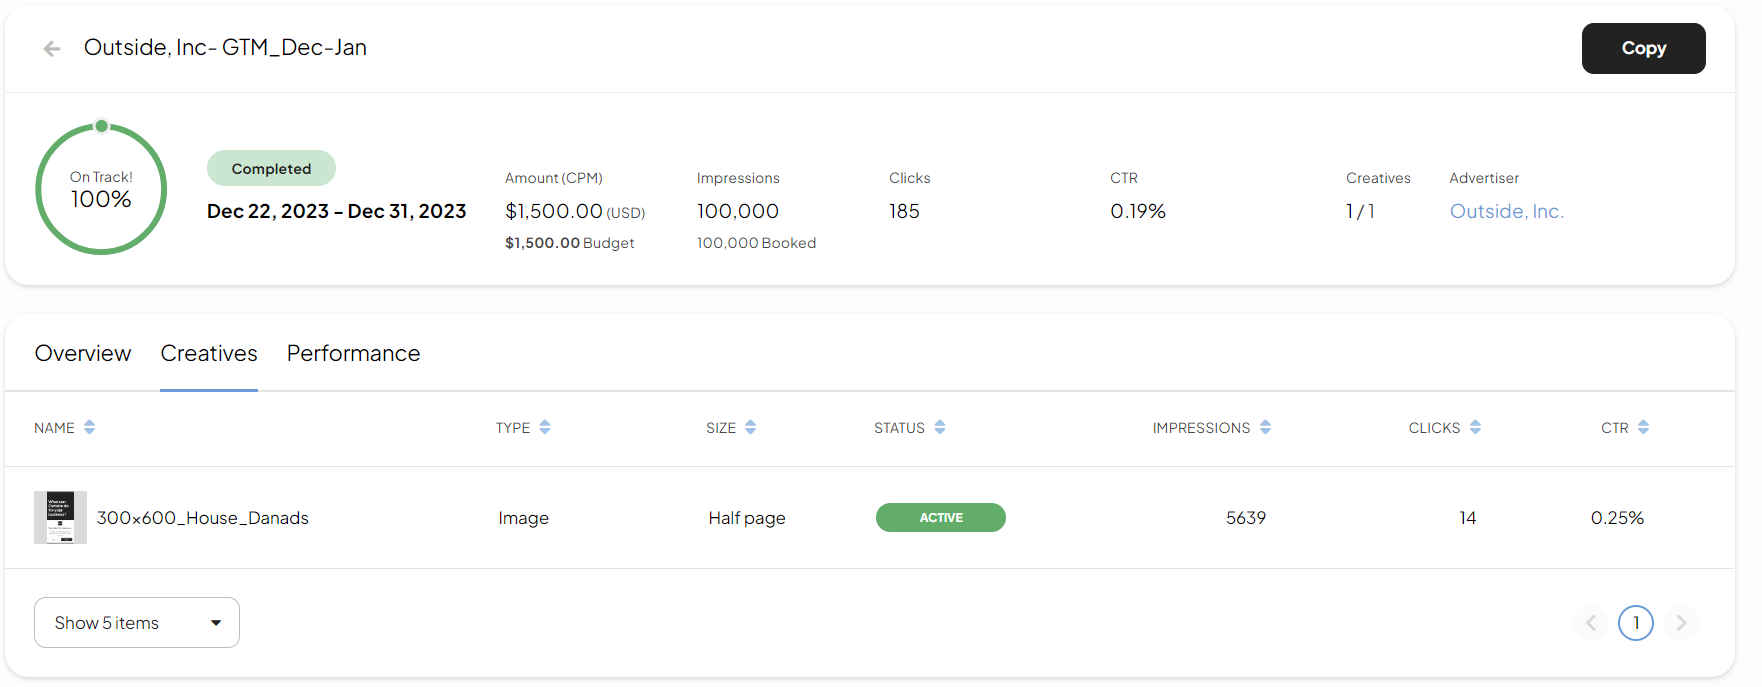
You can also view campaign performance at the creative level.
Performance summary
On your Campaigns Dashboard you can also see a Performance Summary with an overview of total statistics for all your campaigns.
Total Impressions
How many times your ads have been shown.
Total Clicks
Number of times people have clicked your ads.
Total Amount
Total amount delivered.

Campaign performance
When you click into a specific campaign, you can find statics for the individual campaign.

CTR - Click-Through-Rate
In addition to Impressions, Clicks and Amount Delivered, the performance details also show you CTR (Click-Through-Rate).
CTR is the percentage of all the people who saw your ad and clicked on it. CTR is calculated as Clicks/Impressions.
Creatives statistics
Within a specific campaign, you can also view statics by Creative. You can use this level of detail to see which one of your creatives is resonating best with the targeted audience.

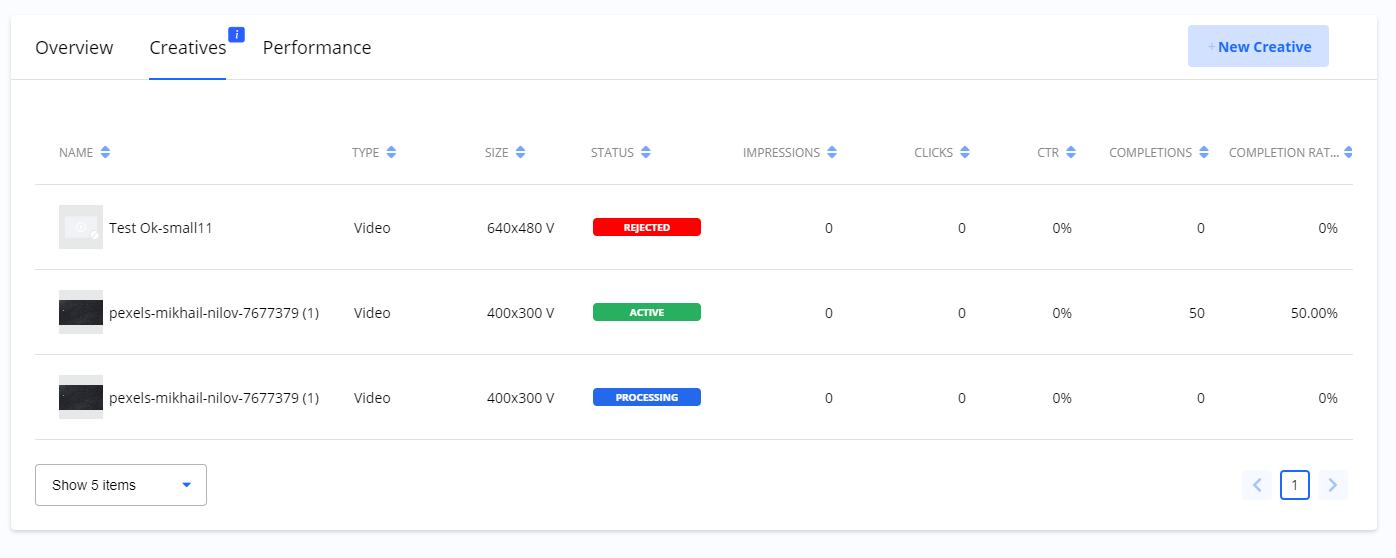
Statistics for video creatives
Statistics for video creatives include:
Impressions
Clicks
CTR
Completions
Completion Rate

